Analytics Module
Overview
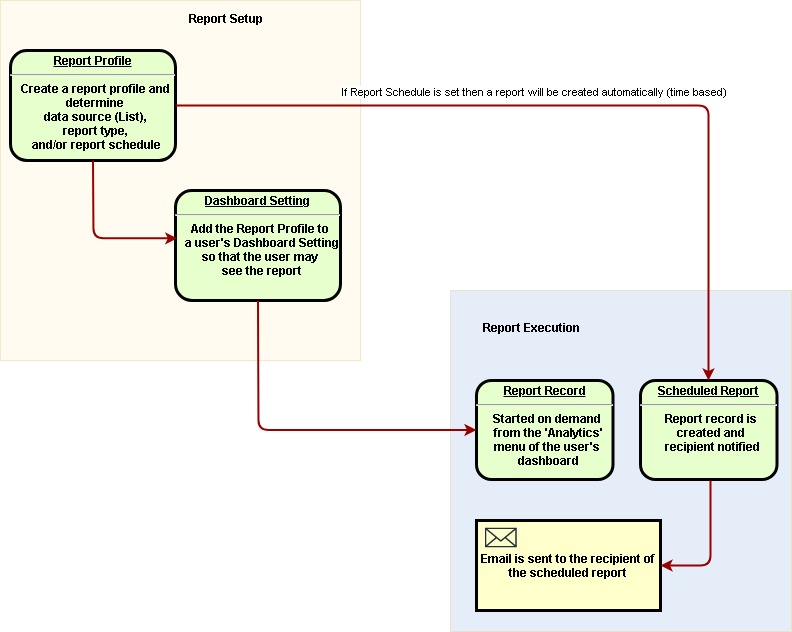
There are 2 main ways of creating reports in the system. The first way is the Analytics module (which is what will be described here) and the second way is through PowerBI integration which is available in the cloud systems and on certain support plans only.
When using the Analytics module Administrators can create report types such as Pie, Bar, Column, Line etc and use the reports to analyse and also communicate vital information to users. These charts can be added straight to users Dashboard as they login or added under the Analytics menu item for the users.

