Edit
Report:
- Once a report is added to a user’s dashboard, they can start it by going to the Analytics dropdown menu and selecting the report.
- They can also start a report from the Start New button in the Analytics Application.
- Each time the user opens a new report, it will be updated with the latest data from the system. If the user clicks the Save button on the report, it will create a snapshot of the data that will not change and can be opened again at a later date from within the Analytics Application.
- Reports that are generated by the system will also be saved as a snapshot of the data and can be accessed at any time from the Analytics Application.
Reports shall have the following data during Edit step:
|
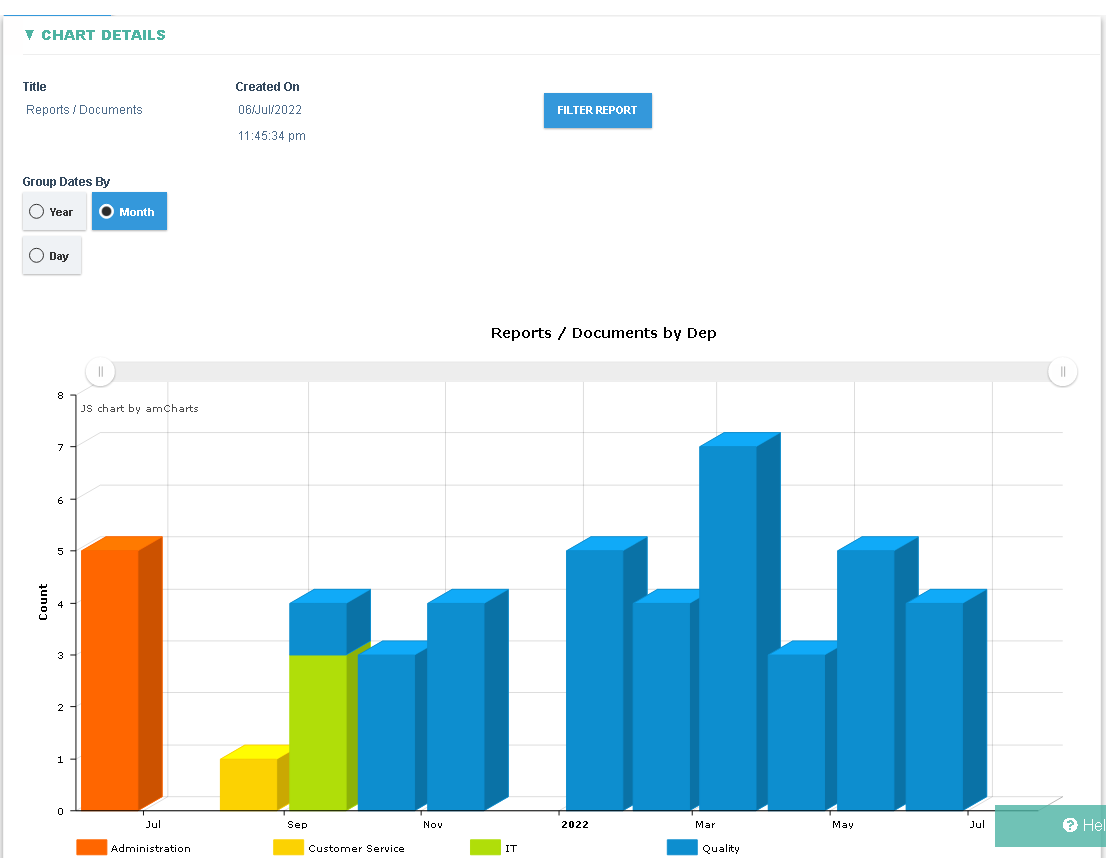
Title: Read-only field containing the Report Profile’s Title. |
|
Created On: Read-only field containing the report's created date. |
|
Filter Report: When this button is clicked, a Search dialog will open containing a number of filters that can be applied to the report. |
|
Chart: This is the chart that gets created based on the data in the Report Profile’s List. The chart is displayed only if the Report Profile’s ‘Hide Chart’ field is unchecked. |
|
If the Report Profile’s Type is Pie, Line, Bar and Column and if the Calculation Type is ‘Count’ then the Chart shall display a count of the values specified in the Report Profile’s Category. |
|
If the Report Profile’s Type is Pie, Line, Bar and Column and if the Calculation Type is ‘Sum’ and if the Category is a numeric field then the Chart shall display a Sum of the Value (Field) specified for the Report Profile’s Category. |
|
If the Report Profile’s Type is Pie, Line, Bar and Column and if the Calculation Type is ‘Average’ and if the Category is a numeric field then the Chart shall display an Average of the Value (Field) specified in the Report Profile’s Category. |
|
If the Report Profile’s Type is ‘Cluster’ or ‘Stacked’ then the Chart shall display a count of the values specified in the Report Profile’s Category compared with the values specified in the Sub Category. |
|
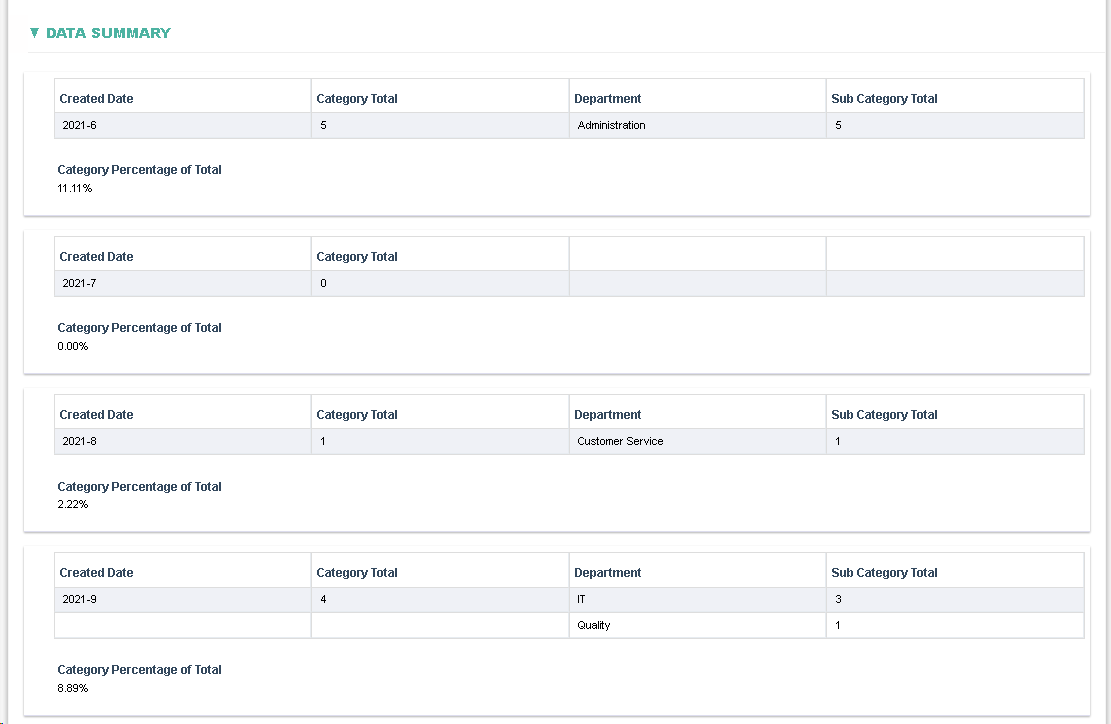
Alongside the visual Chart, and if the Report Type is not ‘Risk Heat Map’, a Data summary shall be displayed that summarises the data displayed in the chart. |
|
Category Name: Read-only field that displays all Categories in the data for the Report Profile. |
|
Category Total: Read-only field that displays a count for each category. |
|
Sub Category Name: For ‘Cluster’ and ‘Stacked’ reports, a Sub Category is displayed for each Category. |
|
Sub Category Total: For each sub category a count is displayed for that sub category. |
|
Category Percentage of Total: displays a % of that category from the total. |
|
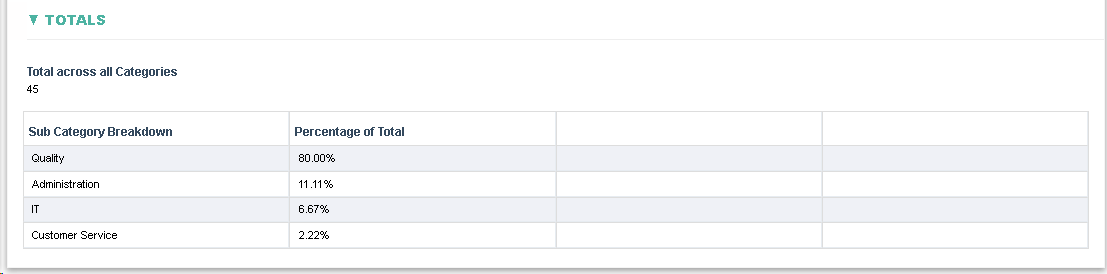
Total across all Categories: Read-only field that displays the total across all categories. |
|
Sub Category Breakdown: Read-only field that is displayed If the report type is ‘Cluster’ or ‘Stacked’. Displays all Sub categories in the report. |
|
Percentage of Total: Read-only field displayed If the report type is ‘Cluster’ or ‘Stacked’. Displays a % of the Sub categories from the total. |
|
Heat Map Data Summary: Read-only field displayed if the Report Type is ‘Risk Heat Map’. Displays all the data in the underlying List of the Report Profile. |